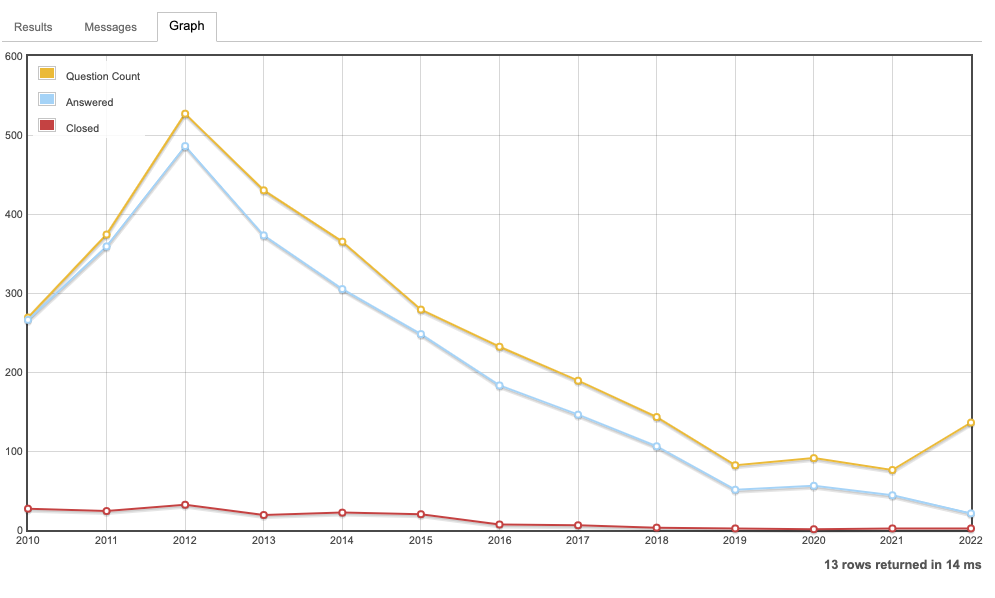
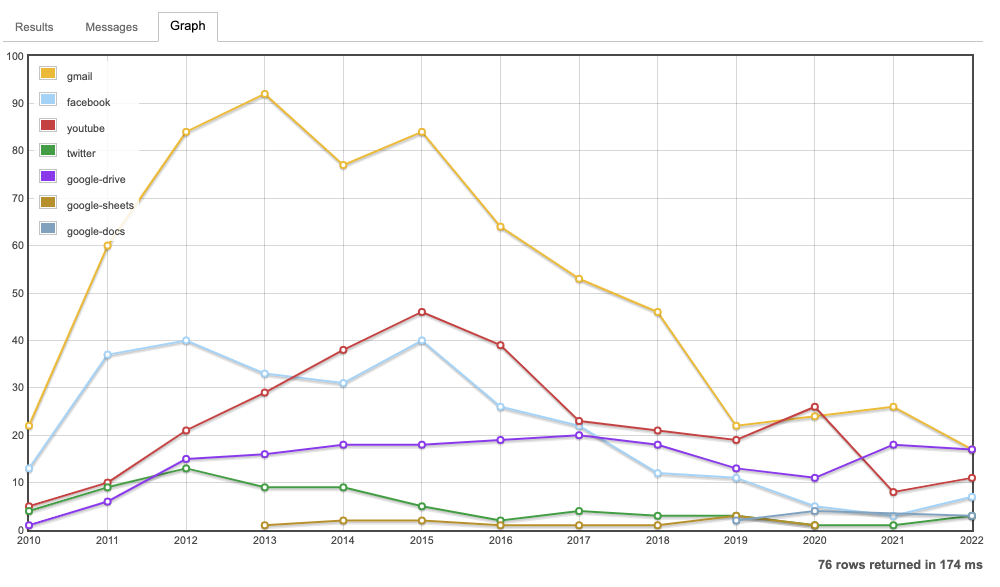
I have being asking myself from a long time how healthy is Web Applications. IMHO it's obvious that the participation in Web Applications have declined over the years as many of the former assiduos users are not participating anymore, there is a very low participation in Meta and the main chat room among other things. These "symptoms" might not be really bad if the participation on the main site were "healthy". Problably looking at the general stats Web Applications might not look in really bad shape but looking at the top popular tags perhaps the conclusion should not be the same as the participation on some these tags have being declining over the years, like gmail and facebook, the 2nd and 3rd tags respectively I'm wondering if we as community should worry / do something about this.
Please take a look to the below graphs and/or to gmail and facebook and share your thoughts about what you think about the participation on these tags, especially during the last 12 months.
Note: If you are familiar with SEDE and know about better queries, please let me know by posting a comment, the same if you find a problem with the queries used.
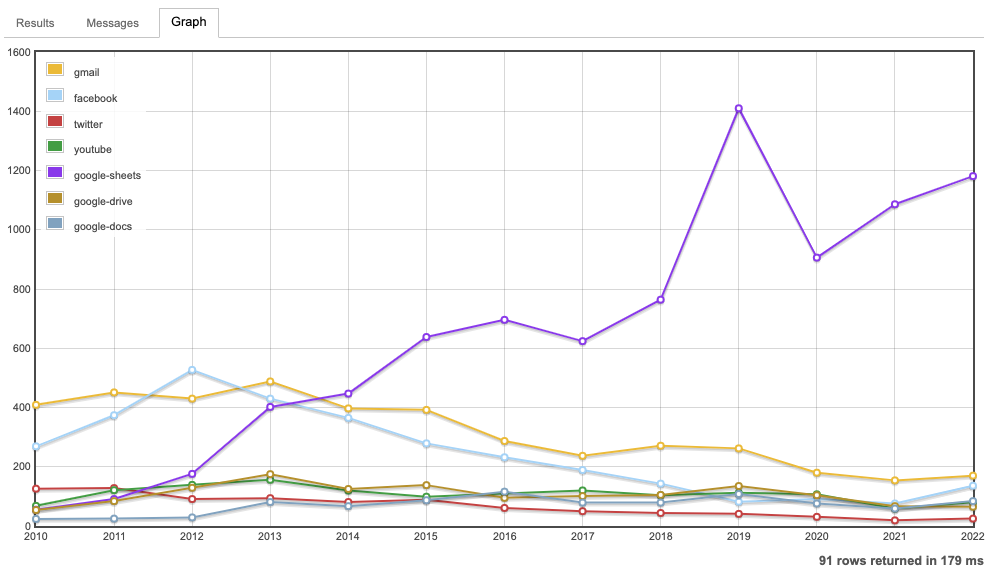
After reading 2022: a year in moderation I took a look to the Tags and was surprsided to see facebook as the 3rd popular tag as most of the questions that I have seen in the last months with this tag have no answers, commets, votes and updates from the OP, so I took a look facebook Top Users and found at that time that in the last 7 and 30 days the unanswered stats were 100%. So I have being looking for SEDE queries and ended crafting some. Following there are some graphs showing some stats about selected the top tags over the time
Selected tags: google-sheets,gmail,facebook,google-drive,google-docs,youtube,twitter.
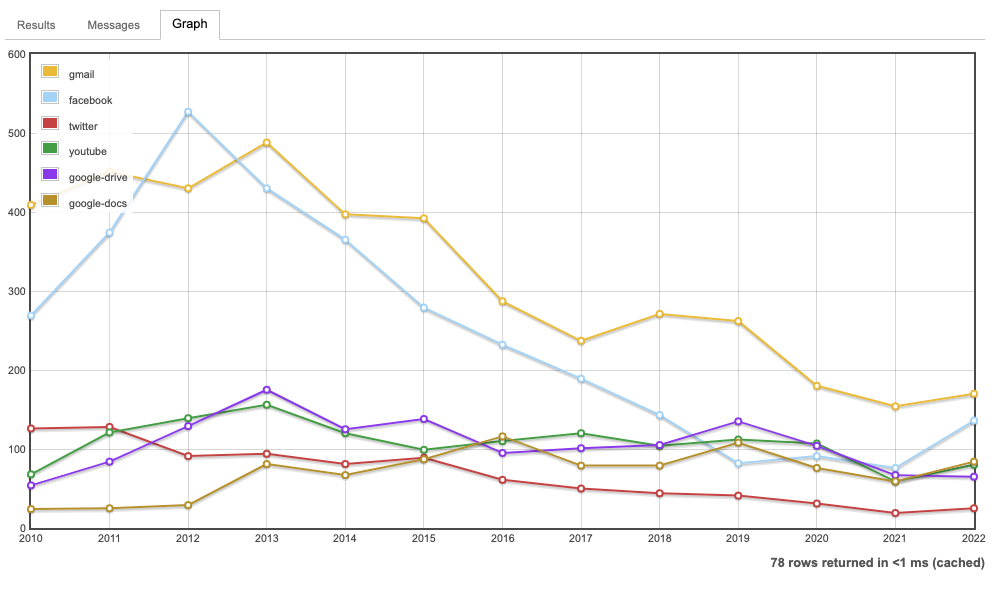
I excluded some top tags that are commonly used together with google-sheets.
Posts by selected tags over the time.
Doesn't include deleted posts. Source: query
Posts by selected tags over the time without including [google‑sheets]
Doesn't include deleted posts.
Same query as above, with the mentioned adjustment.
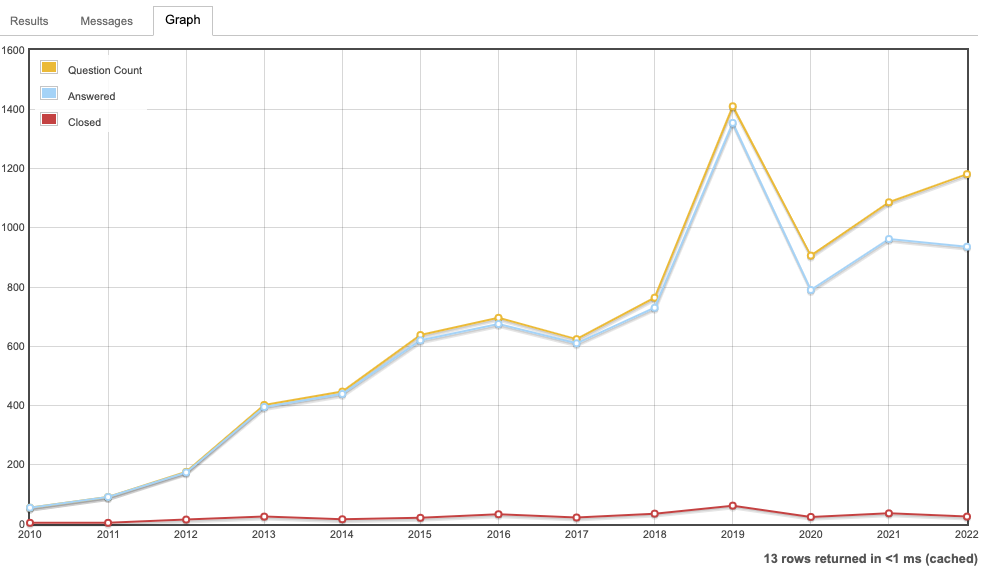
Answer rate for selected tag by year
Doesn't include deleted posts.
[google-sheets]
Initial release March 9, 2006; 16 years ago
Graphs created using SEDE query.
[gmail]
Users 1.5 billion (October 2019) Launched April 1, 2004; 18 years ago
Graphs created using SEDE. Same query as [google-sheets], just changing the selected tag.
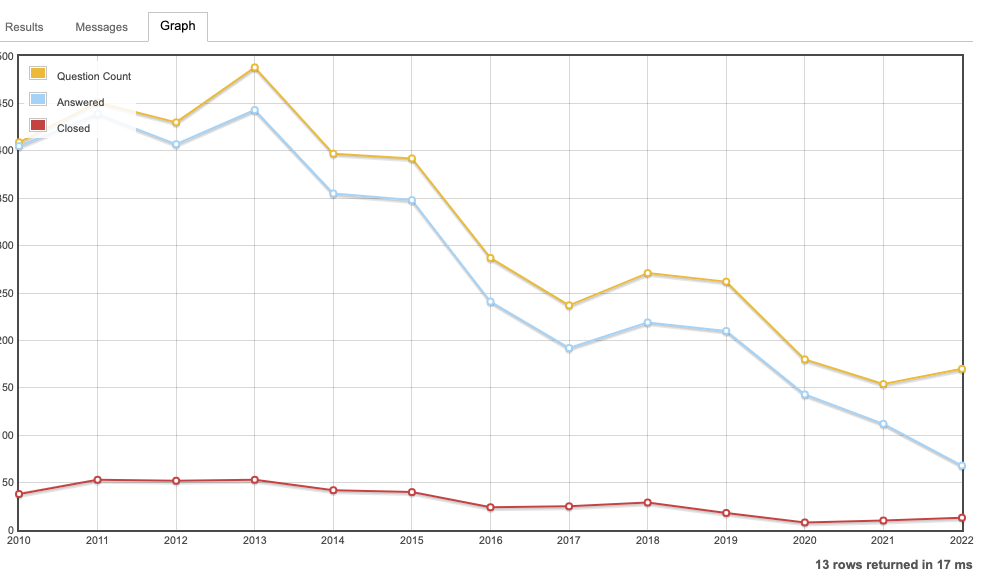
[facebook]
Users Increase 2.94 billion monthly active users (as of 31 March 2022) Launched February 4, 2004; 18 years ago
Graphs created using SEDE. Same query as [google-sheets], just changing the selected tag.

